What is OpenTelemetry and Why is Scout All In?
 Dave Anderson
on
February 02, 2022
Dave Anderson
on
February 02, 2022
What is Telemetry?
Before we talk about OpenTelemetry, we should talk about telemetry. Telemetry is:
the process of recording and transmitting the readings of an instrument
And an instrument is:
a device to measure a physical quantity.
For the purpose of measuring running computer software and systems, our instruments are virtual instruments. That is to say, code that measures other code.
It sounds simple: read a measurement and send it to a remote location. In practice, to make that telemetry data useful in today’s cloud-native and ever more complex environments, there are huge logistical and technical hurdles to overcome. OpenTelemetry is heralding a revolution that will enable disruptions to the monitoring and observability landscape by solving these challenges in an open-source, vendor-agnostic way.
What is OpenTelemetry?
OpenTelemetry is a Cloud Native Computing Federation (CNCF) project started in 2019. The scope of the OpenTelemetry project encompasses how telemetry data is collected, processed, and transmitted. The OpenTelemetry project is not involved with how the data is stored, displayed, or used beyond the collection and transmission phases. OpenTelemetry’s mission is “to enable effective observability by making high-quality, portable telemetry ubiquitous.”
There are three main parts to the OpenTelemetry project to make this a reality.
1. THE OPENTELEMETRY SPECIFICATION
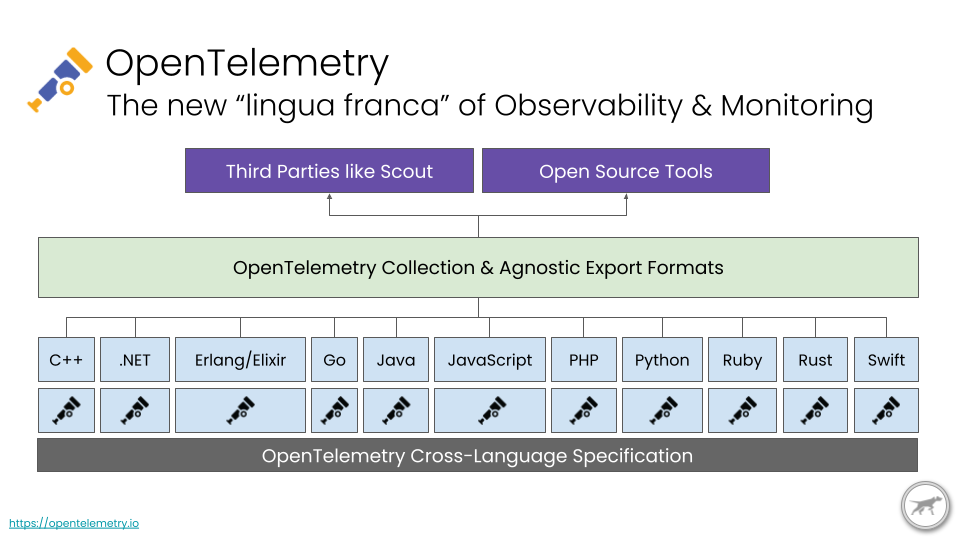
The OpenTelemetry Specification defines the cross-language data specifications including the API, SDKs, and transport protocols. These specs essentially form the new ‘lingua franca’ for Observability, allowing the full stack to speak the same language, gather data in the same format, and ultimately transport that data for processing. This is the crucial puzzle piece required in order to make telemetry truly ubiquitous.
Unified Metrics, Traces, and Logs
OpenTelemetry is defining unified specs for Metrics, Traces, and Logs. Unified is essential to unlocking the power of these separately generated measurements and events. Because OpenTelemetry defines standard conventions for attributes and resources associated with these events, applications and infrastructure stacks that utilize OpenTelemetry will gain vendor agnostic distributed tracing and metric superpowers through the entire application and infrastructure stack.
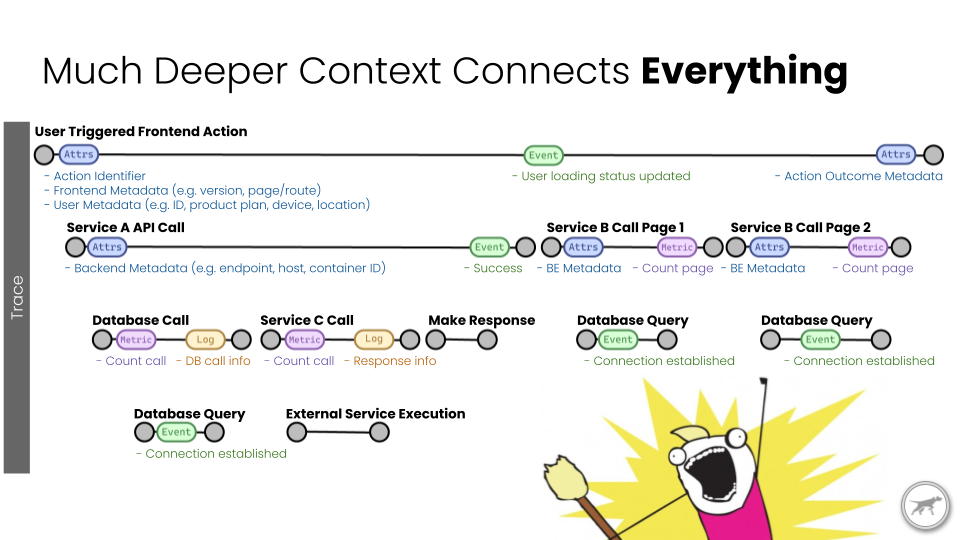
Understanding metrics, traces, and logs with this deep context connects everything.
2. OPENTELEMETRY APIS AND SDKS
There is an API library and SDK library written natively in every major programming language which are the implementations of the OpenTelemetry specification. The API and SDK libraries have different purposes and are used by different developers and are thus deliberately separate libraries.
API Libraries
Historically, APM providers like Scout wrote what are called agents that would dynamically inject code (instruments) into your application's frameworks and libraries such as Rails, Redis, MongoDB, etc., in order to measure and collect telemetry data from your running application. This process of instrumentation was difficult, tedious, and delicate work, and each APM provider had to write their own which meant there was duplicated/wasted effort in simply getting frameworks and libraries instrumented.
This instrumentation work is now being shared among the OpenTelemetry community instead of each APM provider. Now we can all contribute to a single instrumentation implementation for the benefit of everyone.
The long-term (and ideal) goal is to have the framework or library developers themselves use the OpenTelemetry API within their own code, making the instrumentation native to the framework or library. Instead of outside-in instrumentation injected into the frameworks and libraries, it will be baked in natively within the framework or library code.
If a library developer chooses to add native OpenTelemetry instrumentation, the only dependency required is the OpenTelemetry API. The API is designed such that even if the framework or library is instrumented with OpenTelemetry, it will not require the end-user application to make any changes if they don’t want to enable OpenTelemetry instrumentation. This avoids having “instrumented” and “non-instrumented” versions of frameworks and libraries. Finally, the library developers won’t know or care what the specific OpenTelemetry implementation or configuration is within the end-user application. This provides a strong stability guarantee to the library developers which should alleviate concerns about implementing OpenTelemetry within their library.
SDK Libraries
If you are an application developer, the SDK library is what you will be using to configure OpenTelemetry within your application. This is how you will select which libraries to collect telemetry from, how to handle and enrich that data, and how to export or transmit the data.
Exporters are transportation protocol specific libraries that integrate with the OpenTelemetry SDKs. These allow you to send the telemetry data to different backend systems that speak different protocols, such as Jaeger or Zipkin. OpenTelemetry also has its own protocol: OpenTelemetry Line Protocol, or OTLP for short. OTLP utilizes Protobuf to encode the payloads, and utilizes HTTP/S or gRPC for the transport protocol. Every language with an OpenTelemetry SDK also has an OTLP exporter.
3. OPENTELEMETRY COLLECTOR
The OpenTelemetry Collector is an application written in Go. The GitHub readme does an excellent job of describing the collector:
The OpenTelemetry Collector offers a vendor-agnostic implementation on how to receive, process and export telemetry data. In addition, it removes the need to run, operate and maintain multiple agents/collectors in order to support open-source telemetry data formats (e.g. Jaeger, Prometheus, etc.) sending to multiple open-source or commercial back-ends.
Objectives:
Usable: Reasonable default configuration, supports popular protocols, runs and collects out of the box.
Performant: Highly stable and performant under varying loads and configurations.
Observable: An exemplar of an observable service.
Extensible: Customizable without touching the core code.
Unified: Single codebase, deployable as an agent or collector with support for traces, metrics and logs.
While the simplest way to export OpenTelemetry data from your application is directly to a backend via an OTLP exporter, you can optionally send your data to an OpenTelemetry collector. The collector can then process, transform, and relay the data to another endpoint upstream.
What does OpenTelemetry mean for Scout?
OpenTelemetry is leveling the playing field with regard to collecting, processing, and transmitting telemetry data. This focuses the value prop of Monitoring and Observability providers like Scout onto what insights and value you can derive from this newly unified data. This is an inflection point in the monitoring and observability landscape, and the next few years promise to be extremely interesting.
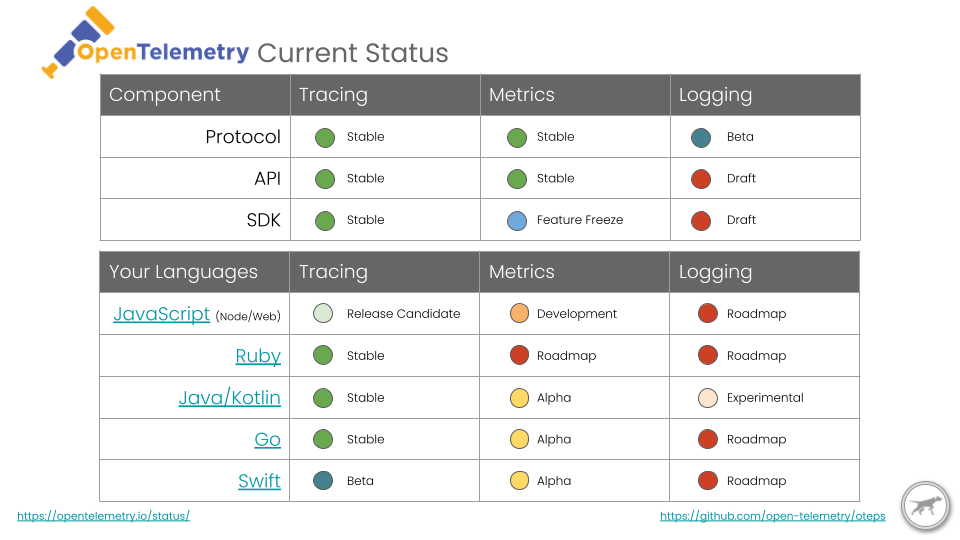
At Scout, we’re building a next generation Observability platform based on OpenTelemetry. We’re taking what we’ve learned over the last 6 years of APM and applying that to become your Full Stack Observability Platform. We are timing our development against the progress of OpenTelemetry becoming stable for metrics, logs, and traces. Traces are already stable, metrics are in a feature freeze as of January 2022, and logs should follow by mid-2022.
If you’re interested in learning more, keeping up to date with our progress, or interested in becoming a beta user on the new platform, sign up at https://scoutapm.com/opentelemetry
And if you're looking to take your organization's observability to the next level, TelemetryHub is definitely worth checking out. This powerful platform offers a range of features that can help you monitor and analyze data from multiple sources, gain insights into your operations, and make data-driven decisions. Interested? Check out TelemetryHub here.